Notice
Recent Posts
Recent Comments
Tags
- 스파르타코팅 UXUI
- IKEA Effect
- 5whys
- 유저페르소나
- 넛지효과
- Mental model discordance
- DataDriven
- 피그마 프로토타이핑
- 모바일 버튼 크기
- mental model
- 공통영역의 법칙
- 제이콥의 법칙
- 근접성의 법칙
- UXUI리뷰
- UX Psychology
- Jakob’s Law
- 밀러의 법칙
- 고객여정지도
- Doherty threshold
- Goal-Gradient Effect
- UX개선사례
- 모달의 개념
- UXUI부트캠프
- Zeigarnik Effect
- 피그마단축키
- Fitts’s law
- 프레임 이해
- 피그마 플러그인
- process flow
- UXUI개선
목록flowchart (1)
Happiness!
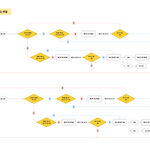 What is a flowchart? / Process Flowchart
A flowchart is a diagram that depicts a process, system or computer algorithm. They are widely used in multiple fields to document, study, plan, improve and communicate often complex processes in clear, easy-to understand diagrams. Flowcharts, sometimes spelled as flow charts, use rectangles, ovals, diamonds and potentially numerous other shapes to define the type of step, along with connecting ..
Design Contents/UXUI
2023. 12. 7. 17:51